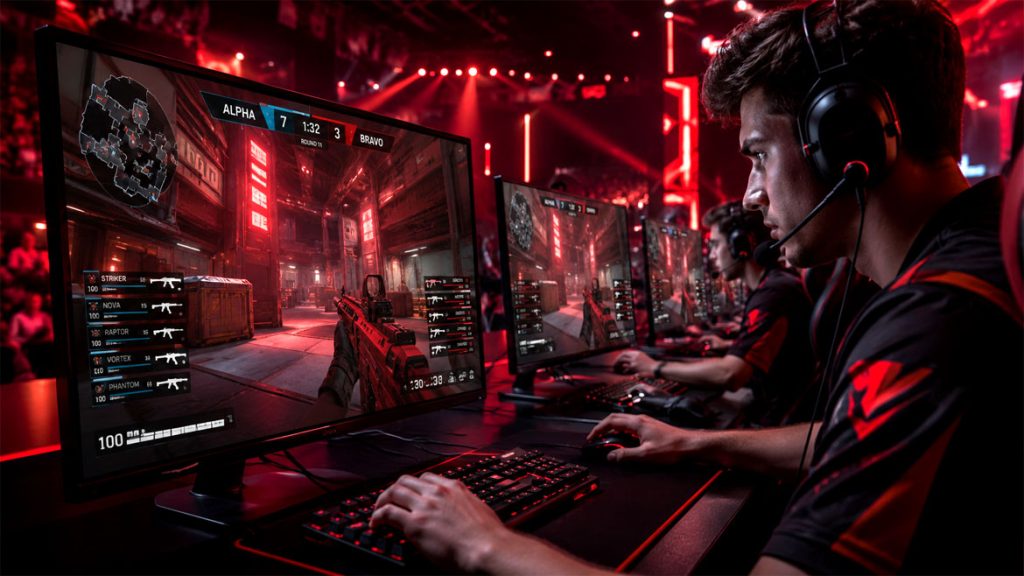

If you watched the 2023 League of Legends World Championship, you saw a percentage for each team pop up on the broadcast, moving as fights swung back and forth. Riot had tried it out at the Mid-Season Invitational that May under the name “Win Expectancy.” Amazon, whose machine learning service runs it, says the model makes a new prediction for every second of play. “WP models aren’t meant to predict which team will win at any given point in time,” Riot’s dev diary on the feature explains. “WP is meant to reflect the relative changes in game-state based on previous performances.” That’s a more modest claim than the graphic makes on screen.
The feature went out as “Win Probability powered by AWS,” a reminder that a stat graphic doubles as ad space. Neal Sayatovich raised a related worry in June about EA’s plan for an advertising platform across its sports titles. Case-opening sites have already copied the head-to-head format and the spectator screen from esports, and I’d expect a win bar to be next, though it would be measuring something quite different from Riot’s.
Battles and the Spectator Screen
 Valve was building spectating into its games years before the case sites existed. It turned SourceTV into GOTV for Counter-Strike: Global Offensive in October 2012 and added a viewer count to the scoreboard a few days later. Dota 2’s Dota Plus subscription now lists a “Spectator Win Probability Graph” among its features.
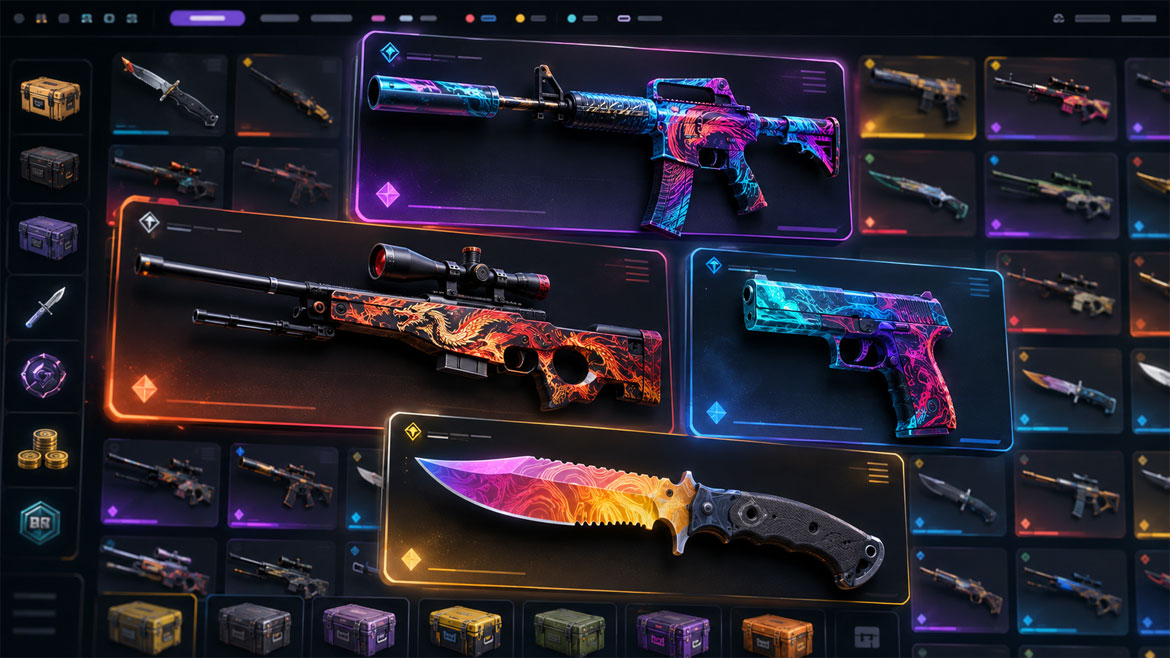
A battle puts two or more players through an identical run of cases with every item shown to everyone at once, and whoever’s haul is worth the most wins. Sites can build their own battle system or license a turnkey case opening platform that includes battles as a module. The platform then connects to their existing accounts through an API. The drop rates are still the site’s to set, and each battle settles against the rates in place before anyone joins.
A Model Versus a Table
 Riot’s percentage is an estimate. The dev diary lists a dozen inputs, among them game time, each team’s share of the gold, experience, towers, dragons, and Baron and Elder buffs, and the model compares the current game state with similar situations in past professional games. It was trained on every pro game since patch 10.4, in early 2020, and new results are added as they come in, so it keeps up as the game changes. Read plainly, a 70 percent figure means teams in comparable positions have gone on to win about seven times in ten.
A case battle’s drop rates are fixed before the first case opens. China made publishers disclose rates like these from May 1, 2017, under a Ministry of Culture notice that also required them to publish players’ draw results and keep the records for at least 90 days. Perfect World, which runs Counter-Strike in China, posted its weapon-case odds that September, from 79.923 percent for Mil-Spec items down to 0.256 percent, roughly one in 390, for the rarest special items. The rule covered publishers’ own draws. It never reached the third-party sites that run battles, which set their own rates and decide for themselves how to show them.
During a battle, only the running totals change. The chance of finishing ahead can be worked out directly from the rates, the value attached to each item and what has already been revealed. In a two-player battle with one case left each, it comes down to the odds that the trailing player’s item beats the leader’s by more than the current gap, and anyone with the table can compute that before the case opens, provided the item values stay fixed for the length of the battle. A win bar on a battle screen would look just like Riot’s and would even be more exact, since it would be arithmetic on the site’s own table rather than an estimate. The difference is what moves it. In League it’s ten players and every call they make; in a battle, it’s the next case.